Vega-lite in svelte

There are many ways of incorporating graphics and plots in svelte and svelte-kit applications. I can definitely recommend checking out this talk by Matthias Stahl, graphics lead at Der Spiegel in Germany. This talk goes specifically through creating animated plots in svelte at the 24:46 mark.

So you can code your own SVG in svelte, use D3, P5, Three.js, etc. In the code below, we use vega-lite.

What I wanted to achieve with this component, is that the user can choose which dimensions are plotted against each other in a scatterplot. It was a bit tricky to get that interactivity working, which is the reason I’m writing it down here.

Our starting point

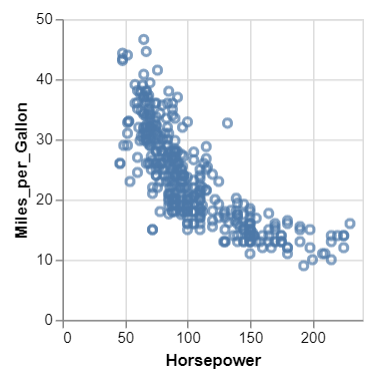
This is the basic plot we want to recreate in svelte, with the added functionality of allowing the user to select the axes.

 1
 2
 3
 4
 5
 6
 7
 8
 9
10
{
  "$schema": "https://vega.github.io/schema/vega-lite/v5.json",
  "description": "A scatterplot showing horsepower and miles per gallons for various cars.",
  "data": {"url": "https://unpkg.com/vega-datasets@1.25.0/data/cars.json"},
  "mark": "point",
  "encoding": {
    "x": {"field": "Horsepower", "type": "quantitative"},
    "y": {"field": "Miles_per_Gallon", "type": "quantitative"}
  }
}

This creates the following plot:

vega cars

The svelte version

In the code below, I have removed the data from the spec itself just because most of my components read their data from an API endpoint. That’s what the <script context="module"> does at the top. So you can skip that part if you want.

 1
 2
 3
 4
 5
 6
 7
 8
 9
10
11
12
13
14
15
16
17
18
19
20
21
22
23
24
25
26
27
28
29
30
31
32
33
34
35
36
37
38
39
40
41
42
43
44
45
46
47
48
49
50
51
52
53
54
55
56
57
58
59
60
<script context="module">
    export async function load({fetch}) {
        const res1 = await fetch('https://unpkg.com/vega-datasets@1.25.0/data/cars.json')
        if ( res1.ok ) {
            return {
                props: {
                    datapoints: await res1.json()
                }
            }
        }
    }
</script>

<script>
    import { default as vegaEmbed } from "vega-embed";
    import { Label, Input } from 'sveltestrap'
  
    export let datapoints = [];
    let width=600
    let height=400
    let fieldX = "Miles_per_Gallon";
    let fieldY = "Displacement"
    let properties = ["Miles_per_Gallon","Cylinders","Displacement","Horsepower","Weight_in_lbs","Acceleration"]

    let spec = {
        "$schema": "https://vega.github.io/schema/vega-lite/v5.json",
        "description": "A scatterplot of two properties for various cars.",
        "mark": "point",
        "encoding": {
            "x": {"type": "quantitative"},
            "y": {"type": "quantitative"}
        }
    }
    $: {
        spec.width = width
        spec.height = height
        spec.encoding.x.field = fieldX
        spec.encoding.y.field = fieldY
        spec.data = { values: datapoints }
    }
    $: {
        if ( typeof document !== 'undefined' ) { vegaEmbed('#vis', spec) }
    }
</script>

<Label style="margin: 10px;">Property for X:</Label>
<Input type="select" bind:value={fieldX}>
    {#each properties as property}
        <option value={property}>{property}</option>
    {/each}
</Input>
<br/>
<Label style="margin: 10px;">Property for Y:</Label>
<Input type="select" bind:value={fieldY}>
    {#each properties as property}
        <option value={property}>{property}</option>
    {/each}
</Input>
<br/>
<div id="vis"></div>

On lines 25 to 33, we create a spec from which we removed all parts that are dynamic: the data, the width and height, and the fields used for the axes. These are added in the following lines 34 through 40. That code block is executed whenever one of its variables changes value.

The vega spec is mounted on the div called vis on line 42.

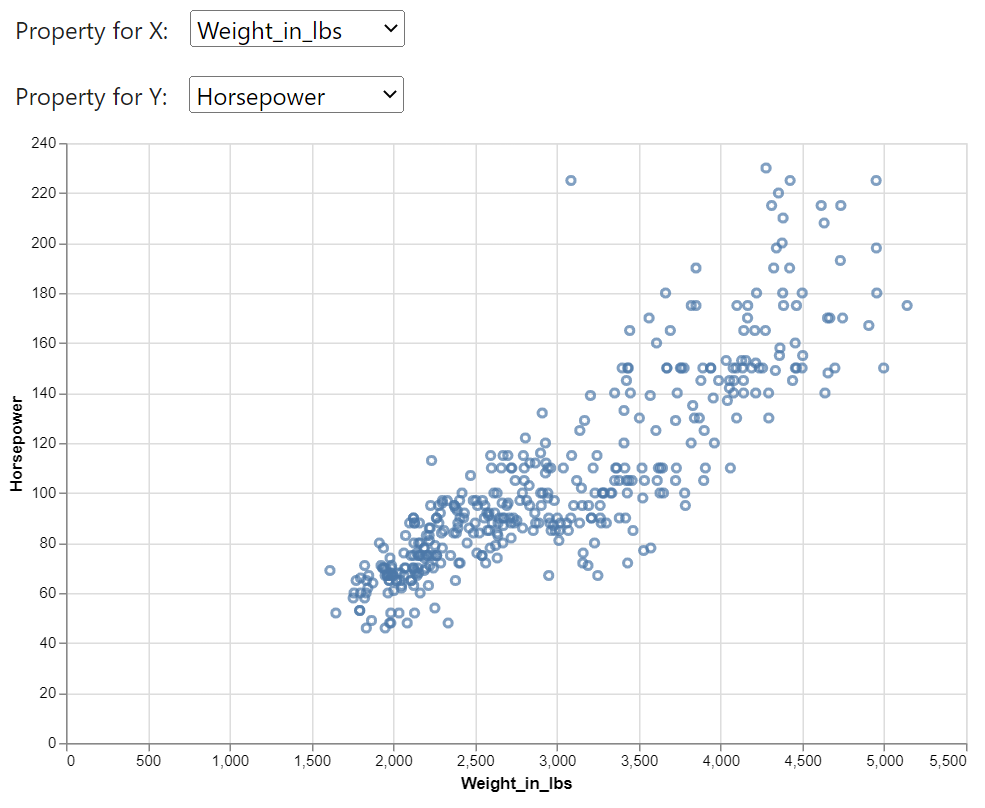
We create two drop-down lists for selecting fieldX and fieldY, looping over all properties and changing the value of these variables.

The result:

vega cars interactive

That’s it.