Clojurescript, re-frame and modular data visualisation
One of the issues we still have is how to combine our custom data visualisations in multi-view dashboards with brushing/linking. We’ll have a programmer work on this for the next two years, but as clojure is a bit of a hobby I’d like to try that out as well. It appears that clojurescript re-frame fits the bill.
Get set up:
|
|
my-project/resources/public/index.html is the landing page for the application. It contains a div with id app that will hold the actual html and svg that we’ll create in views.cljs.
index.html
|
|
The my-project/src/cljs/my_project directory hosts the most important files.
-
core.cljsdefines which div inindex.htmlis used to mount the application. -
db.cljsholds the application state. -
events.cljs: no idea yet what this does… -
subs.cljscontains subscriptions to different parts of the application state -
views.cljsholds the actual application code
I still need to read the '6-domino cascade' part at the re-frame website, so it’s not all clear yet. Will update here where I get there…
Version 1 - Straightforwardly creating separate svg elements
core.cljs: didn’t touch this
|
|
db.cljs holds the app state
|
|
events.cljs
|
|
subs.cljs
|
|
views.cljs is where I define the main panel, as well as the functions to draw circle and rectangle. These latter two should later be moved to separate files so as to make this truly modular.
Note the :on-mouse-over and :on-click (and keep a look at your browser console); we’ll probably use that later for brushing/linking.
|
|
Here’s the result:<br/> image::re-frame_screenshot.png[width=25%]
Here we’re just straightforwardly calling a (map circle @data) to create the separate SVG elements.
Version 2 - A complete plot and passing options
Instead of directly creating a separate circle for each datapoint, we want to create a scatterplot that takes the complete dataset as input.
Step 1: replace map with call to creator function
This is also very simple: we only have to create a scatterplot function, and replace the call in the main-panel.
|
|
circle function, otherwise it will complain.
We now have to replace the call in the main-panel:
|
|
Step 2: passing options to the scatterplot
We might have a border around our scatterplot. Or not… Of course we can create different functions: one for scatterplot without border, and one with border. This obviously is not scalable to other options. So let’s see if we can get this working: draw a scatterplot with a border next to one without.
|
|
This took a while to figure out, simply because the scatterplot function needs to return a single data structure. I must say: figwheel helped a lot here.
|
|
Having access to a REPL that is connected to the browser works wonders. The lein figwheel dev mentioned above starts a REPL that is connected live to your code. Whenever you save your file, these changes are reflected here as well. To investigate what the scatterplot function returned, I’d just run it in that REPL:
|
|
This returns
|
|
Initially, I’d get output where the :rect was not really part of the same data structure. Hence the flatten → partition → map vec.
|
|
The final picture looks like this:<br/> image::re-frame_screenshot_borders.png[width=25%]
Next:
-
getting the id of the element on select/hover…
-
getting mouse position
Version 3 - Getting the mouse position
In order to get the mouse position, we need to unfortunately dig into javascript itself. The code block below prints the mouse position to console whenever the mouse moves over the scatterplot.
|
|
Version 4 - Changing state
At some point we’ll want to change state. Never having used atoms before, I did need some help from [this blog post](http://blog.klipse.tech/clojure/2019/02/17/reframe-tutorial.html).
Changes to db.cljs:
|
|
In subs.cljs:
|
|
In events.cljs:
|
|
In views.cljs, we change circle so that the selected-point stores the value of any point that is clicked on:
|
|
We can then show that e.g. if you click on one of the SVGs. We need to add selected-point to the let, and add an on-click event to an SVG:
|
|
::…
Version 5 - Very simple brushing/linking
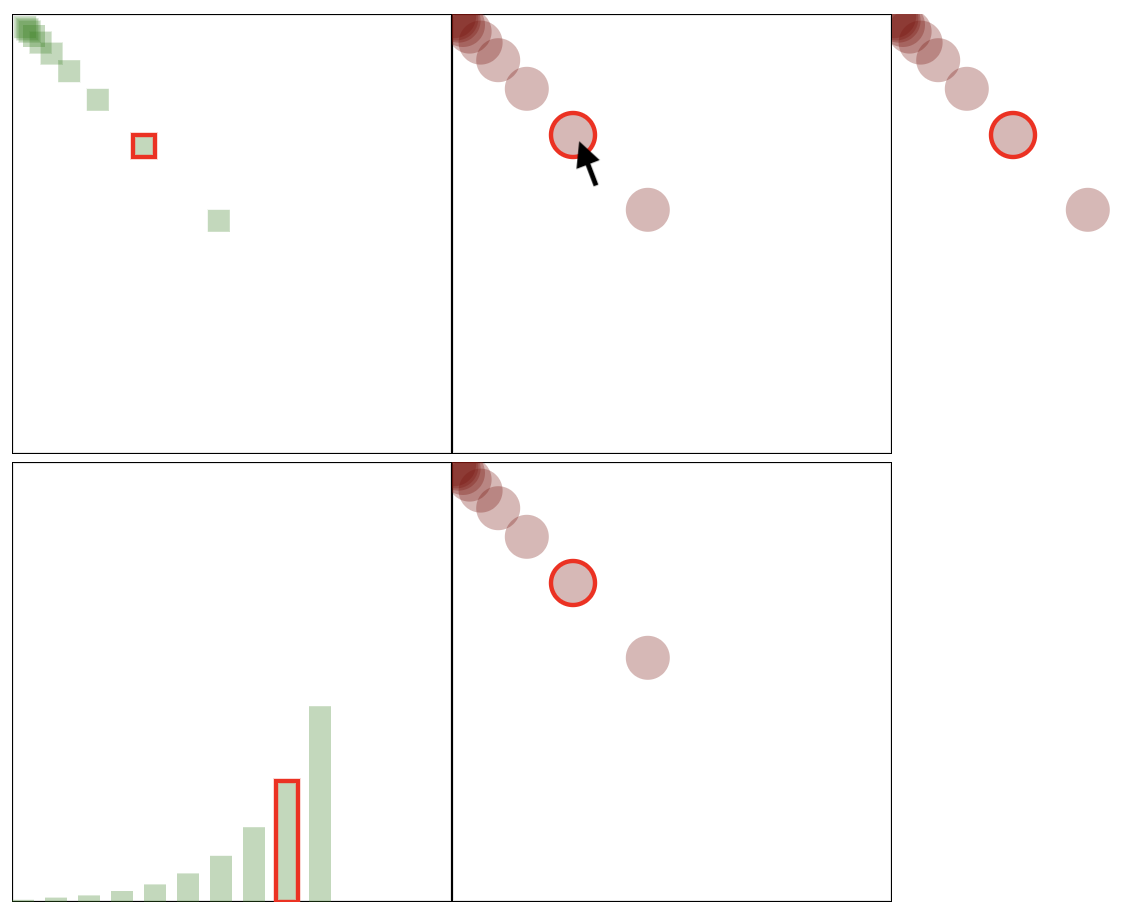
OK. Next step: when I hover over one of the datapoints, I want that datapoint in all other plots to be highlighted.
At this point we need to add CSS to the picture. For the moment I have just put this in the head of the main index.html…
|
|
The idea is that any selected datapoint will get a red border.
In db.cljs we need to add an additional piece of state in the default-db, namely which is the selected point:
|
|
subs.cljs:
|
|
And here’s the tricky part: in the view we need to toggle the class of an SVG element between "selected" and an empty string so as to apply the correct CSS. An element is only redrawn if its parent (i.c. scatterplot or barchart) is redrawn, or if one of its properties changes. At this moment, the only property of scatterplot are opts and data, but we need to add selected to that.
|
|
The only thing changed here is the parameters; the code itself has not changed.
In the main-panel we need to call scatterplot differently of course: we will add the @selected-point parameter.
|
|
Finally, in the circle function we add a :class parameter which is either "selected" or "" based on whether or not that datapoint is the same as @selected-point or not. The :on-mouse-over makes sure that we actually change the selected point when we move our mouse.
|
|
The result looks like this: