Basic scatterplots in Threlte
Svelte is great for data visualisation, but for larger datasets the simple declarative approach to drawing <circle>-s inside an <svg> doesn’t cut it anymore. Other libraries like three.js are capable of handling more data, but they are written for 3D visualisation instead of 2D plots.
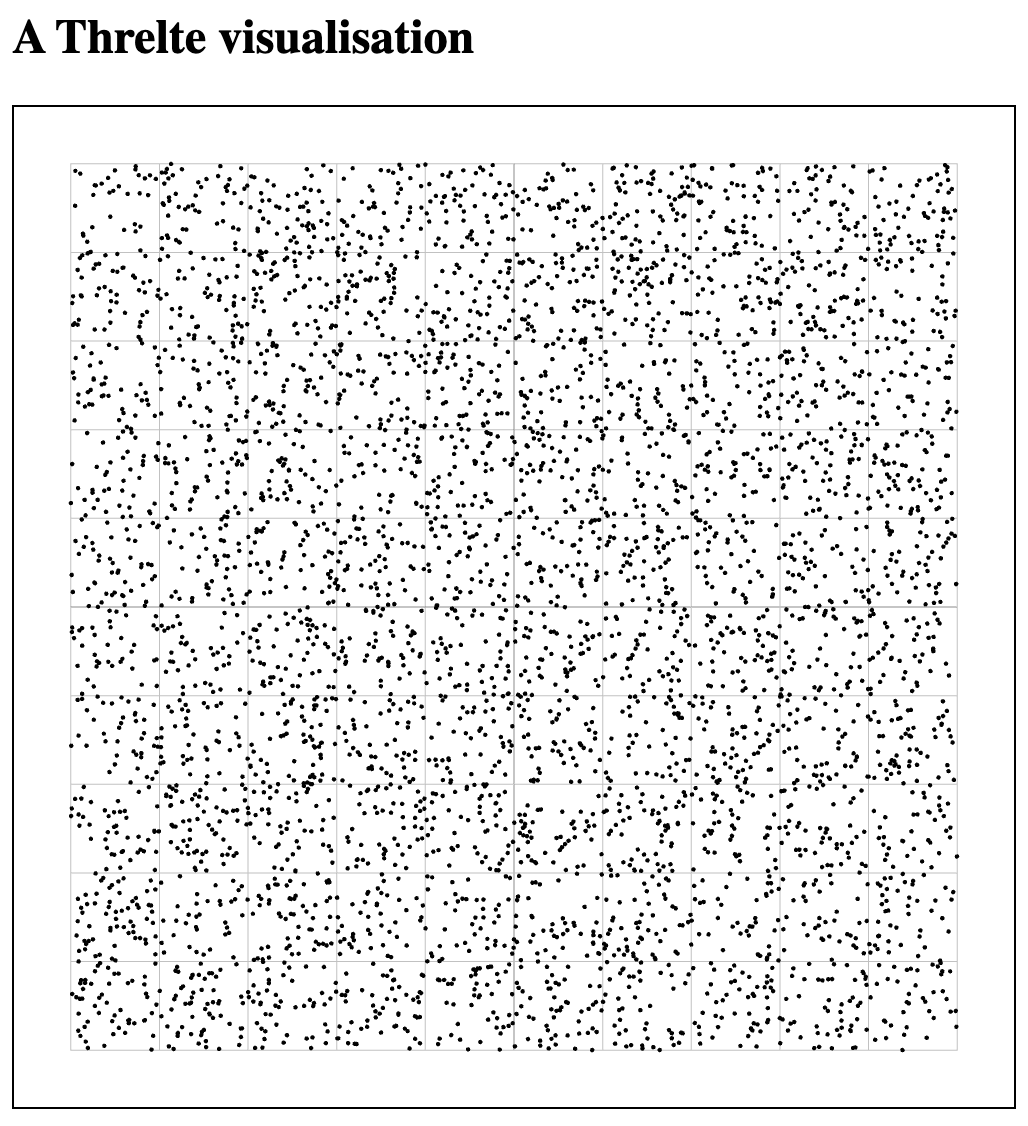
Below, I show a proof-of-concept for a three.js-based 2D scatterplot with 5,000 points.
For installation of svelte-kit and threlte, I refer to their own websites.
Proof-of-principle scatterplot
In +page.svelte we just load SceneOne that we’ll write later.
|
|
Now for the actual code.
For a 2D plot in a 3D world, you basically just make sure that all points are on the same plane. In Threlte, x is left-right, y is top-bottom, and z is near-far. We’ll put all our points on z equal to 0.
The tricky bit was finding out how the camera worked, with the position, fov (field of view), etc. We want to zoom in/out, and pan the plot as well.
Here is the full code that I’ll explain below.
|
|
-
Lines 49 to 50: The actual image that we create is 500x500 pixels.
-
Lines 15 to 20: We create 5,000 datapoints with
xandyvalues between -200 and 200. In contrast to e.g. D3, the origin is not necessarily in the top-left corner, but depends on where you set your camera. -
Lines 36 to 42: This is where the actual points are drawn. As mentioned above, the
zposition for all of them is set to 0.xandyare read from thepointvariable. Each mesh has ageometryand amaterial. For the geometry, we use a sphere with radius 1. -
Lines 28 to 30: To see the data, we need to add a camera. Instead of a
PerspectiveCamerawe use anOrthographicCameraas we’re living in 2D world now. This camera takes different parameters, but we only need to set theposition. By default, this is[0,0,0]but than we wouldn’t see anything because the camera is in the same plane as the datapoints themselves. We therefore pull the camera closer to us. In this case, we takezof 50.-
Being an orthographic camera, the actual value of
zis not so important. You’ll get the same image if you’d use 5 or 5,000. However, it should not be smaller than the radius you give yourSphereGeometry. If the radius of the points is 50 and you set thezof the camera to 30, it will be in the plane of the points.
-
-
Line 29: We add
OrbitalControlsso that we’re able to zoom in/out and pan the image. As this is 3D, we could also rotate the point cloud, but we want to prevent this by settingenableRotate={false}. -
Lines 22, 23 and 34: Although not that visible in the image, we want to add a grid as well. By default, this grid is in the
yzplane, so it needs to be rotated towards thexyplane.
What is not yet included
This is just a proof-of-concept. Still to be added/changed:
-
discs instead of spheres
-
interaction with the points (e.g. showing tooltips)
-
something similar to a D3 brush to select a group of datapoints